State Of Downtown 2017
[vc_section full_width=”stretch_row_content” content_placement=”top” css=”.vc_custom_1524239965210{margin-top: 20px !important;background-position: center !important;background-repeat: no-repeat !important;background-size: contain !important;}”][vc_row content_placement=”middle” css=”.vc_custom_1523988251047{padding-right: 50px !important;}”][vc_column width=”2/3″][vc_single_image image=”9785″ img_size=”large”][/vc_column][vc_column width=”1/3″][vc_column_text css=”.vc_custom_1524174128440{padding-bottom: 25px !important;}”]
Overview
On this page, visitors will find a brief, digital synopsis of the DowntownDC Business Improvement District’s (BID) 2017 State of Downtown Report. Scroll down to access each section of the report and download a PDF of your selected topic area.[/vc_column_text][vc_btn title=”CLICK HERE TO DOWNLOAD A PDF OF THE 2017 STATE OF DOWNTOWN REPORT” style=”3d” shape=”square” color=”turquoise” size=”lg” align=”center” css_animation=”fadeInDown” button_block=”true” link=”url:http%3A%2F%2Fdowntowndc.org%2Fwp-content%2Fuploads%2F2018%2F04%2F2017-State-of-Downtown-Report.pdf||target:%20_blank|”][/vc_column][/vc_row][vc_row][vc_column][vc_separator][/vc_column][/vc_row][vc_row][vc_column][vc_single_image image=”9791″ img_size=”full” alignment=”center”][/vc_column][/vc_row][vc_row][vc_column width=”1/4″][vc_single_image image=”9788″][vc_single_image image=”9789″][/vc_column][vc_column width=”1/2″][vc_column_text]
Dear DowntownDC Stakeholder,
We are pleased to present the 2017 State of Downtown report, produced by the DowntownDC Business Improvement District (BID). This report presents data and analysis highlighting the performance of the BID’s economic and other sectors that contribute to the vibrancy of DowntownDC and the District.
[/vc_column_text][vc_btn title=”CLICK HERE TO READ THE LETTER FROM THE PRESIDENT & CEO AND THE CHAIRMAN OF THE BOARD” style=”3d” shape=”square” color=”turquoise” align=”center” button_block=”true” link=”url:http%3A%2F%2Fdowntowndc.org%2Fwp-content%2Fuploads%2F2018%2F04%2F2017-State-of-Downtown-02-Letter.pdf||target:%20_blank|”][/vc_column][vc_column width=”1/4″][vc_single_image image=”9793″ img_size=”full” alignment=”right”][/vc_column][/vc_row][vc_row][vc_column][vc_single_image image=”9794″ img_size=”full” alignment=”center”][/vc_column][/vc_row][vc_row][vc_column width=”1/3″][vc_single_image image=”9795″ img_size=”full” css_animation=”fadeInLeft”][vc_single_image image=”9796″ img_size=”full” css_animation=”fadeInLeft”][/vc_column][vc_column width=”2/3″][vc_column_text]
Year in Review
DowntownDC in 2017 continued to be a premier regional employment, visitor and cultural and entertainment center, though it faced increasing competition.
The DowntownDC economy performed relatively well in 2017: employment reached a record level; the office market’s operating performance was flat.
The hotel market set new records for performance and total revenues in 2017, helped considerably by the Presidential Inauguration and the Women’s March in January. Monumental Sports & Entertainment’s Capital One Arena and DowntownDC’s 10 museums and eight performing arts venues welcomed 8.2 million patrons in 2017.
[/vc_column_text][vc_single_image image=”9798″ img_size=”full”][/vc_column][/vc_row][vc_row parallax=”content-moving”][vc_column][vc_btn title=”CLICK HERE TO READ THE YEAR IN REVIEW” style=”3d” shape=”square” color=”turquoise” align=”center” button_block=”true” link=”url:http%3A%2F%2Fdowntowndc.org%2Fwp-content%2Fuploads%2F2018%2F04%2F2017-State-of-Downtown-03-Year-in-Review.pdf||target:%20_blank|”][/vc_column][/vc_row][vc_row parallax=”content-moving” css=”.vc_custom_1524069017164{background-image: url(https://downtowndc.org/wp-content/uploads/2018/04/SOD-25.jpg?id=9799) !important;}”][vc_column width=”1/4″][/vc_column][vc_column width=”3/4″][vc_cta h2=”Current Development” shape=”square” color=”green”]
At the end of 2017, 16 projects in DowntownDC were under construction with a total investment of $2.1 billion and an additional four projects were set to break ground in 2018, with a total investment of $440 million. Though office buildings continued to account for a clear majority of the DowntownDC’s built space in 2017, mixed-use development continues to grow.
[/vc_cta][vc_btn title=”CLICK HERE TO READ CURRENT DEVELOPMENT” style=”3d” shape=”square” color=”green” align=”center” button_block=”true” link=”url:http%3A%2F%2Fdowntowndc.org%2Fwp-content%2Fuploads%2F2018%2F04%2F2017-State-of-Downtown-04-Current-Development.pdf||target:%20_blank|”][/vc_column][/vc_row][vc_row][vc_column][vc_single_image image=”9800″ img_size=”full” alignment=”center” css_animation=”fadeInUp”][/vc_column][/vc_row][vc_row][vc_column width=”2/3″][vc_single_image image=”9801″ img_size=”full”][/vc_column][vc_column width=”1/3″][vc_column_text]
Employment
Employment at the end of 2017 in DowntownDC was estimated at 188,300, making DowntownDC the largest employment center in the region and one of the largest in the nation. When the BID was first formed in 1997, DowntownDC was responsible for close to 100% of the of the city’s job growth, and today accounts for 11%. DowntownDC employment in 2017 accounted for 23.8% of all District employment and represented 0.4% growth. The District’s 2017 job growth of 0.75% was below the 1.8% job growth in Northern Virginia and Suburban Maryland and the 1.6% national job growth.
[/vc_column_text][/vc_column][/vc_row][vc_row][vc_column][vc_btn title=”CLICK HERE TO READ MORE ABOUT EMPLOYMENT” style=”3d” shape=”square” color=”green” align=”center” button_block=”true” link=”url:http%3A%2F%2Fdowntowndc.org%2Fwp-content%2Fuploads%2F2018%2F04%2F2017-State-of-Downtown-05-Employment.pdf||target:%20_blank|”][/vc_column][/vc_row][vc_row][vc_column][vc_single_image image=”9802″ img_size=”full” alignment=”center”][/vc_column][/vc_row][vc_row][vc_column width=”1/2″][vc_column_text]
Office Market
DowntownDC in 2017 continued to be one of the most attractive office markets in the nation, anchored by the presence of the federal government, its location at the center of the regional transportation system and its diverse amenities. During 2017, the office market in the DowntownDC BID area and DC set a new record sales price for a commercial office building at 900 G Street NW.
The office market also experienced continued densification, gained a marginal increase in effective rents due to record concessions, experienced higher vacancies and continued to be attractive to foreign investors. A total of 3.1 million square feet (SF) of office space was under construction in 2017, approximately 50% of the city’s total construction of office space.
[/vc_column_text][/vc_column][vc_column width=”1/2″][vc_single_image image=”9805″ img_size=”full” css_animation=”fadeInRight”][vc_btn title=”CLICK HERE TO READ MORE ABOUT OFFICE MARKET” style=”3d” shape=”square” color=”green” align=”center” button_block=”true” css=”.vc_custom_1524171753448{margin-top: -15px !important;}” link=”url:http%3A%2F%2Fdowntowndc.org%2Fwp-content%2Fuploads%2F2018%2F04%2F2017-State-of-Downtown-06-Office-Market.pdf||target:%20_blank|”][/vc_column][/vc_row][vc_row][vc_column width=”1/2″][vc_single_image image=”9806″ img_size=”full”][/vc_column][vc_column width=”1/2″][vc_single_image image=”9807″ img_size=”full”][/vc_column][/vc_row][vc_row][vc_column][vc_single_image image=”9808″ img_size=”full” alignment=”center”][/vc_column][/vc_row][vc_row][vc_column width=”1/3″][vc_single_image image=”9817″ img_size=”full” css_animation=”fadeInLeft”][/vc_column][vc_column width=”2/3″][vc_column_text]
Hotels, Tourism & Conventions
The 30 hotels in the DowntownDC BID with their 11,202 hotel rooms set an operating performance record in 2017 for the third consecutive year. It was also the fifth consecutive year for record hotel revenues in DowntownDC.
The District set a tourism visitation record in 2016 (the latest year for which data is available) with 22 million visitors, an increase of 3.3% over 2015. Overseas visitors (not including Canada and Mexico) accounted for 2 million visitors in 2016, down slightly from a record total in 2015. The city’s 2.09 million overseas visitors in 2016 ranked DC No. 8 in the nation behind New York City, Miami, Los Angeles, Orlando, Las Vegas, San Francisco and Hawaii.
The Walter E. Washington Convention Center continued to be a major driver of both DowntownDC visitor activity and hotel room occupancy in 2017. The Convention Center hosted 177 events for 1.2 million attendees. Destination DC’s booked hotel rooms accounted for 13.6% of DowntownDC hotel demand in 2017, which helped DowntownDC’s hotel performance remain highest in the region and fourth in the country after New York City, San Francisco and Boston.
[/vc_column_text][/vc_column][/vc_row][vc_row][vc_column width=”1/2″][vc_single_image image=”9822″ img_size=”full” alignment=”center”][/vc_column][vc_column width=”1/2″][vc_media_grid grid_id=”vc_gid:1524240261557-37396756-e4aa-8″ include=”9819,9818,9821″][vc_btn title=”CLICK HERE TO READ MORE ABOUT HOTELS, TOURISM & CONVENTIONS” style=”3d” shape=”square” color=”warning” align=”center” button_block=”true” link=”url:http%3A%2F%2Fdowntowndc.org%2Fwp-content%2Fuploads%2F2018%2F04%2F2017-State-of-Downtown-07-Hotels-Tourism-Conventions.pdf||target:%20_blank|”][/vc_column][/vc_row][vc_row][vc_column width=”1/2″][vc_single_image image=”9820″ img_size=”full”][/vc_column][vc_column width=”1/2″][vc_column_text]
Culture & Entertainment
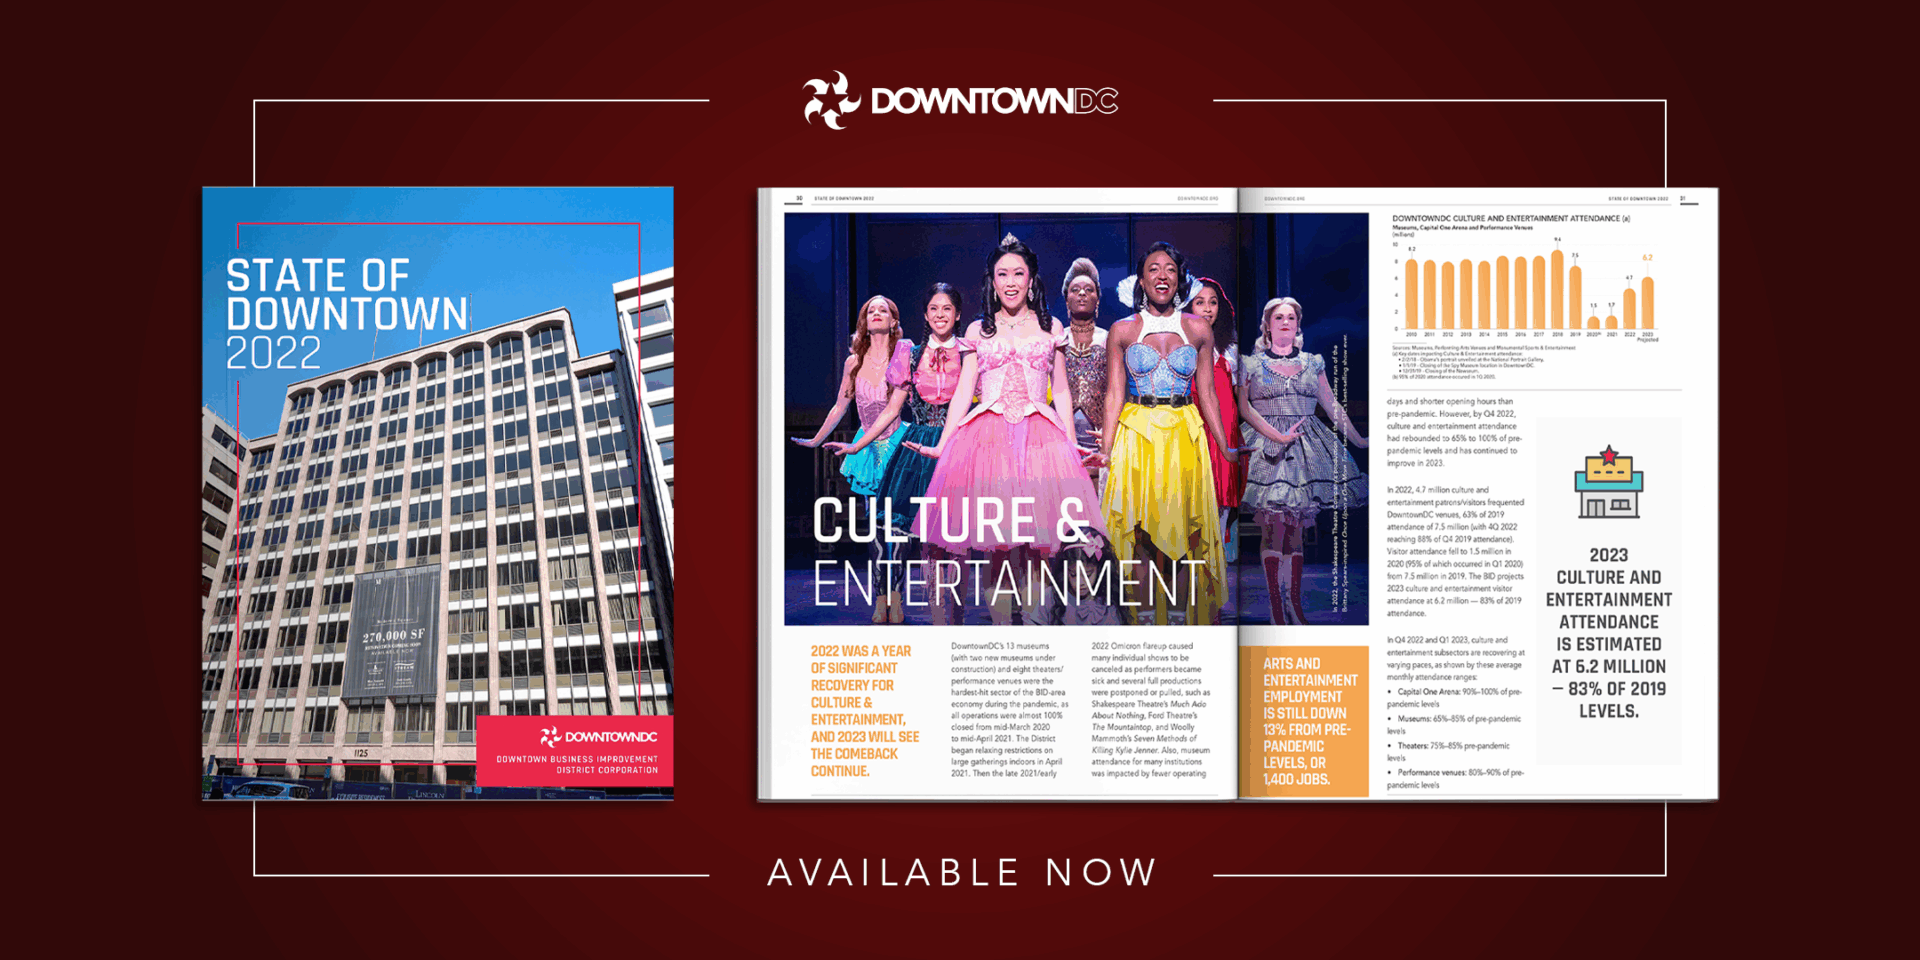
DowntownDC’s culture and entertainment economy continued to be propelled in 2017 by Monumental Sports & Entertainment’s Capital One Arena, eight performing arts venues and 10 museums. Together, these venues drew 8.2 million visitors to DowntownDC in 2017.
Performing arts attendance in DowntownDC grew by 11% in 2017 to 811,000 patrons, led by increased attendance at the Warner Theatre and the National Theatre. DowntownDC’s eight performing arts venues each attracted between 49,000 and 201,000 patrons in 2017.
[/vc_column_text][vc_single_image image=”9823″ img_size=”full”][vc_btn title=”CLICK HERE TO READ MORE ABOUT CULTURE & ENTERTAINMENT” style=”3d” shape=”square” color=”warning” align=”center” button_block=”true” link=”url:http%3A%2F%2Fdowntowndc.org%2Fwp-content%2Fuploads%2F2018%2F04%2F2017-State-of-Downtown-08-Culture-Entertainment.pdf||target:%20_blank|”][/vc_column][/vc_row][vc_row][vc_column][vc_single_image image=”9824″ img_size=”full” alignment=”center”][/vc_column][/vc_row][vc_row][vc_column width=”1/6″][vc_single_image image=”9827″ img_size=”full”][/vc_column][vc_column width=”2/3″][vc_column_text]
Shopping & Dining
The year 2017 marked the highest retail lease rate ever in the history of the District in DowntownDC: Capital One Bank signed a lease for $400 per square foot (SF) for the former Fuddrucker’s space at H & 7th streets in Chinatown, and will open a Capital One Café there in late 2018.
The DowntownDC BID had a record 888,000 SF of destination stores and a record 166 destination restaurants as of April 2018. Sephora, Uniqlo and Christofle led the modest number of new stores that opened in 2017 in DowntownDC.
[/vc_column_text][/vc_column][vc_column width=”1/6″][vc_single_image image=”9828″ img_size=”full”][/vc_column][/vc_row][vc_row][vc_column width=”1/3″][vc_single_image image=”9830″ img_size=”medium” alignment=”center” css_animation=”fadeInLeft”][/vc_column][vc_column width=”1/3″][vc_single_image image=”9831″ img_size=”large” alignment=”center” css_animation=”fadeInUp”][/vc_column][vc_column width=”1/3″][vc_single_image image=”9829″ img_size=”medium” alignment=”center” css_animation=”fadeInRight”][/vc_column][/vc_row][vc_row][vc_column][vc_btn title=”CLICK HERE TO READ MORE ABOUT SHOPPING & DINING” style=”3d” shape=”square” color=”warning” align=”center” button_block=”true” link=”url:http%3A%2F%2Fdowntowndc.org%2Fwp-content%2Fuploads%2F2018%2F04%2F2017-State-of-Downtown-09-Shopping-Dining.pdf||target:%20_blank|”][/vc_column][/vc_row][vc_row][vc_column][vc_single_image image=”9832″ img_size=”full” alignment=”center”][/vc_column][/vc_row][vc_row][vc_column width=”2/3″][vc_column_text]
DowntownDC Living
The DowntownDC BID’s 7,054 housing units represented 7% of all built space in DowntownDC, and 2.2% of DC’s approximately 325,000 housing units.
The DowntownDC BID’s average Class A rent declined 3% in 2017 from $3.29 per square foot (SF) in 2016 to $3.19 per SF, and its vacancy rate increased from 2.9% to 5.6%. The 2017 rent decline and vacancy increase correlated with the rest of DC and the region. The modest decline in operating performance was the result of significant new apartment supply in other parts of DC and the region.
[/vc_column_text][vc_single_image image=”9835″ img_size=”full” css_animation=”fadeInLeft”][vc_single_image image=”9837″ img_size=”full” css_animation=”none”][/vc_column][vc_column width=”1/3″][vc_single_image image=”9834″ img_size=”large” css_animation=”fadeInRight”][vc_single_image image=”9836″ img_size=”large” css_animation=”fadeInRight”][/vc_column][/vc_row][vc_row][vc_column][vc_btn title=”CLICK HERE TO READ MORE ABOUT DOWNTOWNDC LIVING” style=”3d” shape=”square” color=”primary” align=”center” button_block=”true” link=”url:http%3A%2F%2Fdowntowndc.org%2Fwp-content%2Fuploads%2F2018%2F04%2F2017-State-of-Downtown-10-DowntownDC-Living.pdf||target:%20_blank|”][/vc_column][/vc_row][vc_row][vc_column][vc_single_image image=”9838″ img_size=”full” alignment=”center”][/vc_column][/vc_row][vc_row][vc_column width=”1/3″][vc_single_image image=”9839″ img_size=”full” css_animation=”fadeInDown”][vc_single_image image=”9842″ img_size=”large” css_animation=”fadeInLeft”][/vc_column][vc_column width=”2/3″][vc_column_text]
Transportation
Metrorail in 2017 continued to be the engine for commuters in DowntownDC, which is home to seven Metrorail stations that together serve all six lines. DowntownDC’s Metrorail stations served a combined average of 89,732 customers each weekday.
June 2017 marked the end of SafeTrack, the triage maintenance program which resulted in large, extended shutdowns of portions of the entire Metrorail network beginning in June 2016. The diminished service during SafeTrack was partially responsible for a decrease in overall Metrorail ridership from 639,000 customers per weekday in 2016 to 613,000 customers per weekday in 2017.
[/vc_column_text][vc_single_image image=”9840″ img_size=”full”][/vc_column][/vc_row][vc_row][vc_column][vc_btn title=”CLICK HERE TO READ MORE ABOUT TRANSPORTATION” style=”3d” shape=”square” color=”primary” align=”center” button_block=”true” link=”url:http%3A%2F%2Fdowntowndc.org%2Fwp-content%2Fuploads%2F2018%2F04%2F2017-State-of-Downtown-11-Transportation.pdf||target:%20_blank|”][/vc_column][/vc_row][vc_row][vc_column][vc_single_image image=”9868″ img_size=”full” alignment=”center”][/vc_column][/vc_row][vc_row][vc_column width=”5/6″][vc_column_text]
DowntownDC At A Glance
The DowntownDC Business Improvement District (BID) in 2017 celebrated its 20th year and revived its focus on public space beautification and activation, supporting individuals experiencing homelessness and developed a vision for the next decade on how to best grow DowntownDC to maintain its competitiveness.
In Congress, Del. Eleanor Holmes Norton introduced legislation in 2017 that enables the District of Columbia to enter into an agreement with the U.S. National Park Service to rebuild, operate and maintain Franklin Park and will give management and operation authority of the park to the BID. The legislation has been approved by the US House of Representatives and is currently making it was through the US Senate. This is an exciting and important role that the BID is eager to assume for DowntownDC’s largest green space.
The BID in 2017 partnered with Mayor Muriel Bowser and the Coalition for Non-Profit Housing and Economic Development (CNHED) to establish a Landlord Partnership Fund to incentivize landlords across the city to increase the availability of rental housing units.
[/vc_column_text][vc_row_inner][vc_column_inner width=”1/3″][vc_single_image image=”9850″ img_size=”full” css_animation=”fadeInDown”][/vc_column_inner][vc_column_inner width=”1/3″][vc_single_image image=”9847″ img_size=”full” css_animation=”fadeInUp”][/vc_column_inner][vc_column_inner width=”1/3″][vc_single_image image=”9851″ img_size=”full” css_animation=”fadeInDown”][/vc_column_inner][/vc_row_inner][/vc_column][vc_column width=”1/6″][vc_single_image image=”9844″ img_size=”full”][/vc_column][/vc_row][vc_row][vc_column][vc_btn title=”CLICK HERE TO READ MORE ABOUT DOWNTOWNDC” style=”3d” shape=”square” color=”primary” align=”center” button_block=”true” link=”url:http%3A%2F%2Fdowntowndc.org%2Fwp-content%2Fuploads%2F2018%2F04%2F2017-State-of-Downtown-12-DowntownDC-at-a-Glance.pdf||target:%20_blank|”][/vc_column][/vc_row][vc_row][vc_column width=”1/3″][/vc_column][vc_column width=”1/3″][vc_single_image image=”9643″ img_size=”full”][vc_btn title=”CLICK HERE TO READ THE DOWNTOWNDC BIDS FY2017 ANNUAL REPORT” style=”3d” shape=”square” color=”danger” size=”lg” align=”center” button_block=”true” link=”url:http%3A%2F%2Fdowntowndc.org%2Freport%2Fannual-report-fy2017%2F|||”][/vc_column][vc_column width=”1/3″][/vc_column][/vc_row][/vc_section]


